“Student performance is proven to be more effective when …”
“We have the evidence that students perform better if …”
“If we implement this system, then it will cause students to do better.”
Statements like these are often heard in the field of education, but they may not be valid, and the proof or evidence or cause may not be as straightforward as often assumed. In fact, it may not even exist.
We heard claims like these recently in Arizona in relation to its A-F school grading accountability system, and because of this, we took it upon ourselves to investigate the accuracy, or rather, validity of these very statements. We realized our findings were relevant and important, especially for other states currently using or considering adopting school letter grades as their “proven pathway” to improve student achievement.
In short, the Arizona State Board of Education formed a seven-member technical advisory board to inform the state about its continued utilization of its A-F grading system, which was initially implemented in 2010-2011. While most technical advisory board members perpetually voiced concerns about the state’s system, and more specifically the lack of evidence supporting its efficacy, the A-F system was being continuously defended, fortified, and pushed by one of the seven technical advisory board members. Members of the State Board appointed this member to the technical advisory board partly because (s)he represented ExcelinEd—the nonprofit that played a large part in the state’s adoption of its A-F system.
ExcelinEd, formally known as the Foundation for Excellence in Education (FEE), identifies itself as a nonprofit that is led by Jeb Bush and based out of Florida. The organization is labeled as a 501(c)(3) nonprofit, with its main interests associated with state-level educational reform like state-level A-F school letter grades. Some of its major contributors include the Bill and Melinda Gates Foundation, the Walton Family Foundation, the Michael Bloomberg Foundation, and educational organizations such as ACT, McGraw-Hill, Pearson, Northwest Evaluation Association, College Board (which administers the SAT), and the Educational Testing Service (the company that oversees the Advanced Placement exams).
Around the same time Arizona adopted its A-F system, ExcelinEd representatives were quite literally “on tour,” touting similar plans state-by-state (e.g., Florida, Indiana, Louisiana, Mississippi, New Mexico, Oklahoma, and Utah) and convincing other state boards of education to adopt comparable A-F grading systems for similar purposes. ExcelinEd was pushing said plans to also help states improve their student achievement by holding their schools more accountable for the grade letters they received, with high-stakes consequences attached to incentivize schools to take their letter grades even more seriously. In Arizona, for example, the State Board tied state-level funds to schools’ letter grades to add what were viewed as the essential teeth needed to make their A-F grading policies matter.
The stronger the accountability the higher the subsequent student achievement, right?
Notwithstanding, the ExcelinEd board member pushed strongly for his/her organization’s agenda during board meetings, much to the consternation of the other six advisory board members. These members questioned why someone from another state, who did not have deep contextual knowledge about Arizona’s education system, was so aggressive in continuing with an agenda that the other members were not convinced worked. In fact, the other six members continuously called for specific evidence as laid out in the Standards for Educational and Psychological Testing, which outlines which practices are effective and beneficial for improving student performance. These standards are endorsed by three major professional organizations in education: the American Educational Research Association (AERA), the American Psychological Association (APA), and the National Council on Measurement in Education (NCME).
Ultimately, and after friction amongst the group ensued and became increasingly obvious and nettlesome, the ExcelinEd board member resigned. Before leaving, however, (s)he placed into public record the following:
Student achievement on the National Assessment of Educational Progress (NAEP) provides evidence that Arizona [is] moving in the right direction with [its] original A-F school grading system… [In addition]…[s]ince Arizona started grading schools A-F in 2010-2011, student achievement on [the] NAEP has outpaced the Nation [sic]. And, when comparing outcomes for the same period prior to the implementation of the original A-F school grading system, Arizona students made more progress after implementation than in the years before.” (ExcelinEd, 2018; see also Bush, 2017)
The insertion of this statement into public record was followed by fervent discussion among the rest of the advisory board, all of whom also publicly expressed four main concerns: (1) this board member was not from their state; (2) the claimed results were exaggerated; (3) the results did not at all or did not accurately represent minoritized student group performance, which actually contradicted what was defined as necessary practice as per ExcelinEd; and (4) any statistical analyses that ExcelinEd presented did not include appropriate evidence of statistical or practical significance.
To better understand A-F letter grade policies and the repercussions of using them to make significant decisions across states, another member of the technical advisory board subsequently requested evidence from other states with A-F grading systems. Thereafter, our team was assembled to conduct a study that would assess the relationship between incorporating A-F accountability systems and student performance on the NAEP test, specifically on NAEP’s fourth and eighth grade mathematics and reading exams.
Our primary question was as follows: Have NAEP test scores improved after the implementation of the A-F accountability system?
A-F school letter grading systems: What are they?
About one decade after states began to focus on student-level accountability policies after the implementation of No Child Left Behind (NCLB) in 2001, after states also reported problems with the school-level adequate yearly progress (AYP) systems that they also put into place post-NCLB, A-F accountability systems began to be adopted and implemented by some states.
“Intuitively” modeled after the A-F letter grades that many students receive in their own classes throughout most PreK-20 schools located throughout the United States, A-F accountability systems were employed, as also briefly noted prior, to help states hold schools accountable for their effects on student learning and to help increase student achievement as a result of schools being held accountable for their effects or lack thereof. The more the rewards and incentives attached to school-level performance, the more “successful” the accountability system is to be, again, in terms of increased student achievement that is to result (Bush, 2017).
Other, albeit oft-secondary purposes of such systems are to deliver to parents, to the public, and to the schools themselves up-to-date information on school performance. While school performance is defined differently by state (e.g., student test scores on state tests, disciplinary data, attendance data, school safety indicators, per-pupil expenditures, teacher evaluation results, school surveys, school climate data, community services, programs for specialized populations), and states determine how much weight each variable is given prior to determining schools’ letter grades, student test scores always carry significant weight across states’ A-F systems. Emphases on student test scores as the primary and most heavily weighted measure of any school’s summative performance is endorsed by ExcelinEd, especially over other more holistic (e.g., “dashboard”) types of systems.
Thirteen states currently use A-F accountability grading systems. Across these states, what we know from the literature is that use of A-F grades strongly influences public perceptions about any state’s schools, even though the information A-F systems provide may not be as accurate a representation of student and school performance as often believed. Related, A-F grading systems have been criticized for being too limited to give valuable insight into how students actually perform, especially beyond the large-scale standardized tests used across such systems. As research has shown, reductionistic views of complex systems in education have costly implications, including persistent concerns about the levels of support that the American public has for its education system. Put simply, system output, as well as the decisions made based off of the information derived via A-F accountability systems, influences public perceptions of the education system and can shape the ways that the public supports education, also as a public good, regardless of whether the grading system yields an accurate or valid picture of a state’s schools.
Mixed results and exaggerated claims
Because the NAEP is not associated with high-stakes accountability measures, we used these scores to compare performance across the aforementioned 13 states that implemented A-F grading systems. When we compared student performance on the fourth and eighth grade mathematics and reading NAEP scores, we found mixed results (see Appendix A), leading us to question the claims made by the ExcelinEd board member’s claims above. While we did find that Arizona’s NAEP scores had improved for fourth and eighth grade mathematics and fourth grade reading, as compared to the nation, eighth grade mathematics results showed the state was on pace with the rest of the country. As we continued our analysis, we found that other states had also performed in similar ways, meaning that they improved in some areas, and in other areas not so much.
Overall, we found that about half of states increased student achievement post policy implementation and half did not, evidencing that states’ adoptions of A-F policies does not increase student achievement as often assumed or intended, but rather yields seemingly random results.
More specifically, as compared to the nation, we found that while states like Arizona did improve on three of the four NAEP measures we examined after they incorporated their A-F school letter grade accountability systems (see also Florida, Indiana, Mississippi, West Virginia, and Utah), many states performed in the inverse (i.e., decreased performance on three of four measures) or worse (i.e., decreased performance across the board). These states included Alabama, Arkansas, New Mexico, North Carolina, Ohio, and Oklahoma. Texas students increased in their mathematics achievement in grades 4 and 8 and decreased in their reading achievement in grades 4 and 8 after they incorporated their A-F school letter grade accountability systems, also as compared to the nation.
As such, and given the ExcelinEd member claimed that implementation of the A-F grading system was the cause for improvement in student performance in Arizona, and also across states, we evidenced in our study via empirical examinations of NAEP data across the aforementioned 13 states that have adopted such A-F school letter grade policies that this claim is seriously suspect.
Conclusion
The findings from our research do not support the further encouragement of states, or rather state boards of education, to adopt A-F school letter grading system given our results, overall, show that thirteen states are neither better nor worse in relation to the rest of the United States in terms of using this structure as a causal reason for increasing student achievement. State performance on the NAEP appears to not follow a pattern post A-F policy implementation, and results suggest NAEP results are really not very different from the toss of a coin.
These findings are also important, especially as we consider why certain organizations are pushing forward their no uncertain agendas, much of the time along with aggressive claims of proof, but with no actual empirical evidence in support. Perhaps the evidence herein can help school board members, at minimum, rethink that which they take up as fact or fiction.
Kevin Winn (kevin.p.winn@asu.edu) is a doctoral student at Arizona State University, where Tray Geiger (tjgeiger@asu.edu) is a doctoral candidate, and Audrey Amrein-Beardsley (audrey.beardsley@asu.edu) is a professor.
References
Bush, J. (2017). Florida’s intuitive letter grades produce results. Education Next, 17(1). Retrieved from https://www.educationnext.org/floridas-intuitive-letter-grades-produce-results-forum-jeb-bush-accountability/
ExcelinEd. (2018). Arizona technical advisory committee: Recommendations from ExcelinEd [Member name removed]. Tallahassee, FL.
Appendix A
State-By-State Graphs of Grade 4 and Grade 8 NAEP Mathematics Composite Scores Over Time
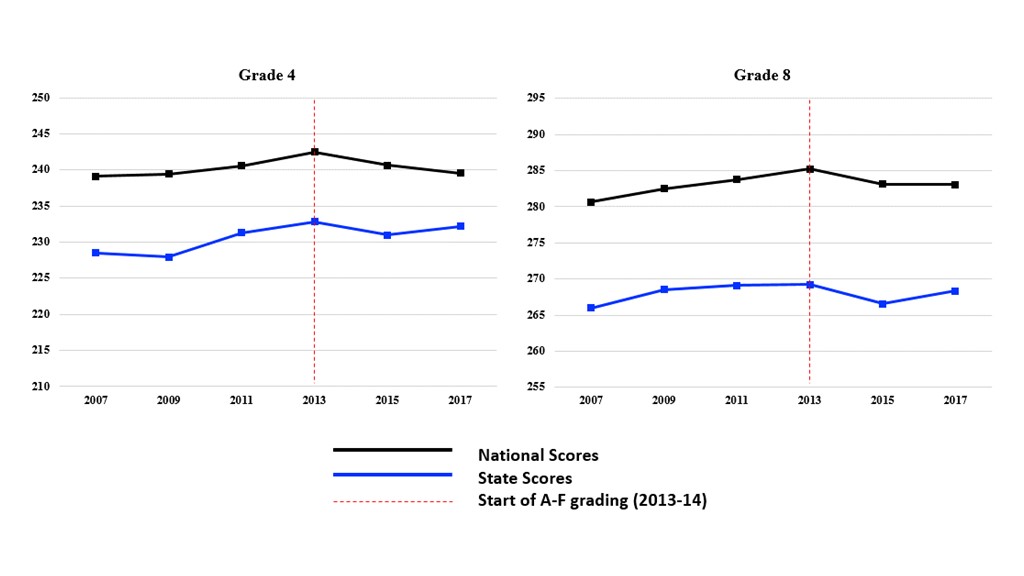
Figure 1. Alabama grade 4 and grade 8 mathematics composite scores over time
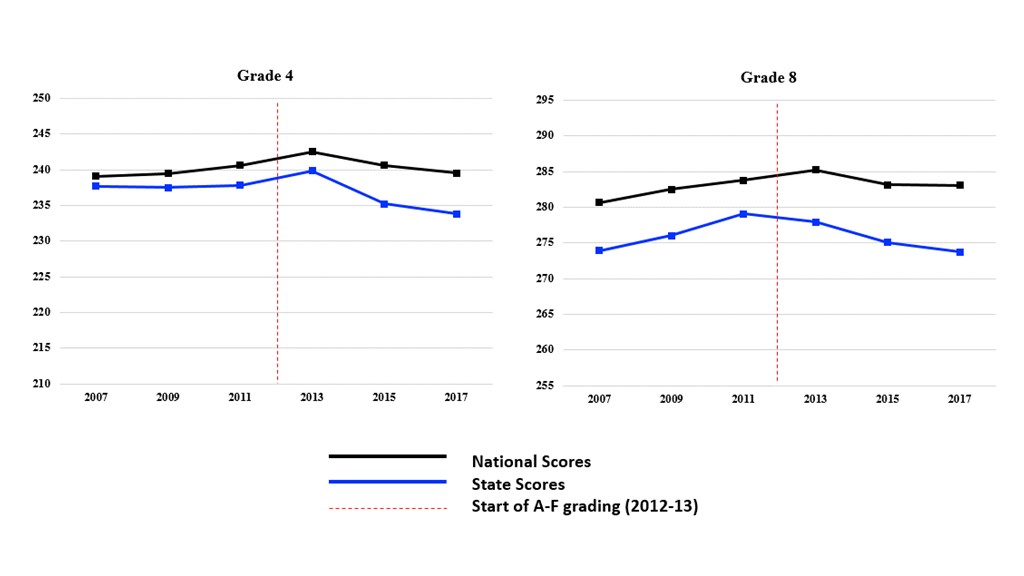
Figure 2. Arkansas grade 4 and grade 8 mathematics composite scores over time
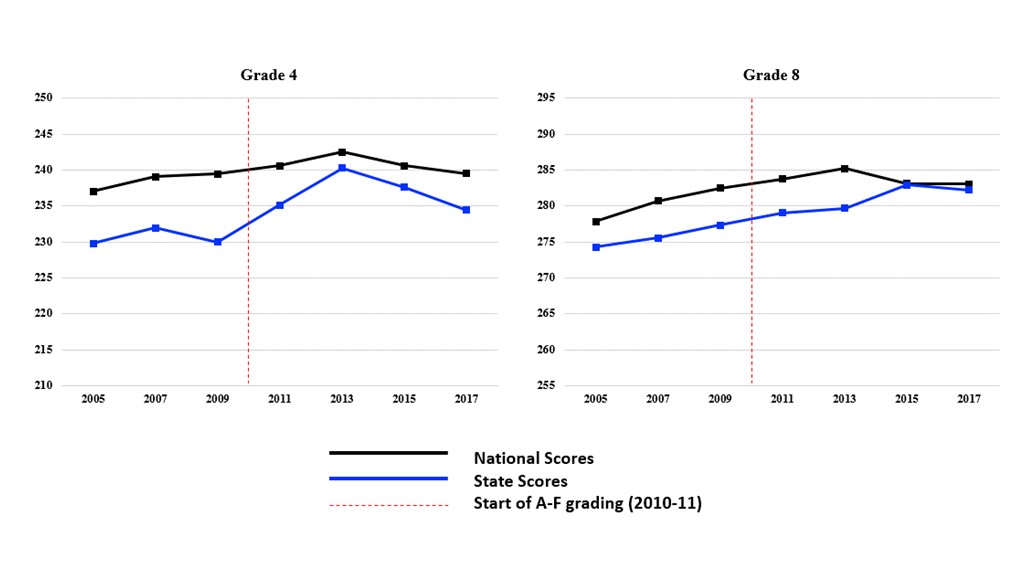
Figure 3. Arizona grade 4 and grade 8 mathematics composite scores over time
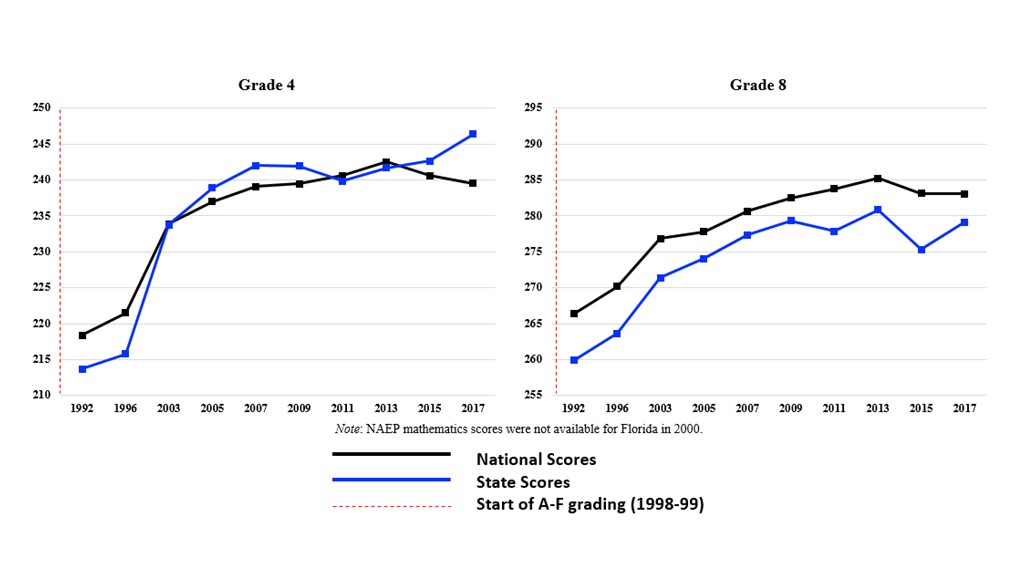
Figure 4. Florida grade 4 and grade 8 mathematics composite scores over time
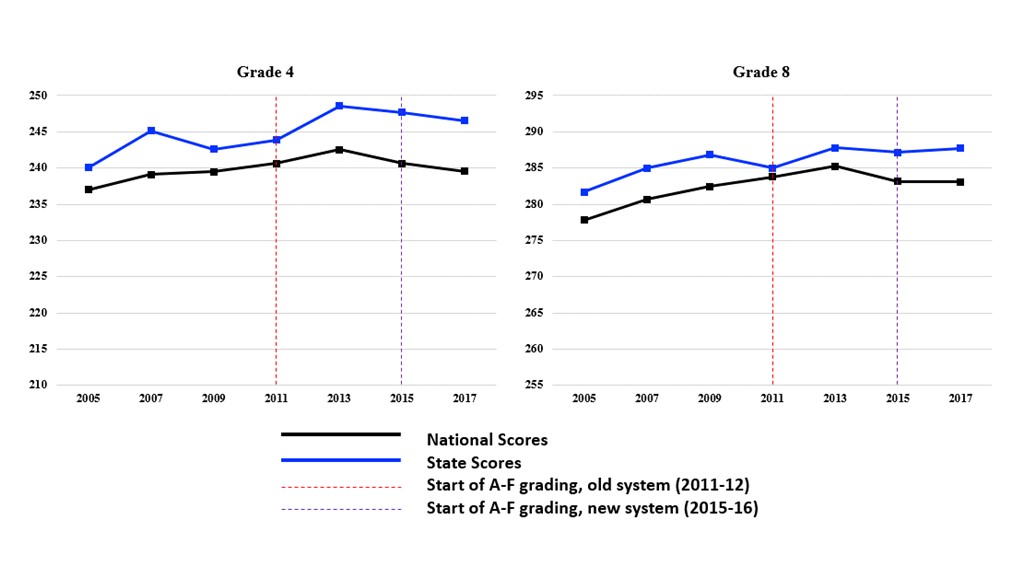
Figure 5. Indiana grade 4 and grade 8 mathematics composite scores over time
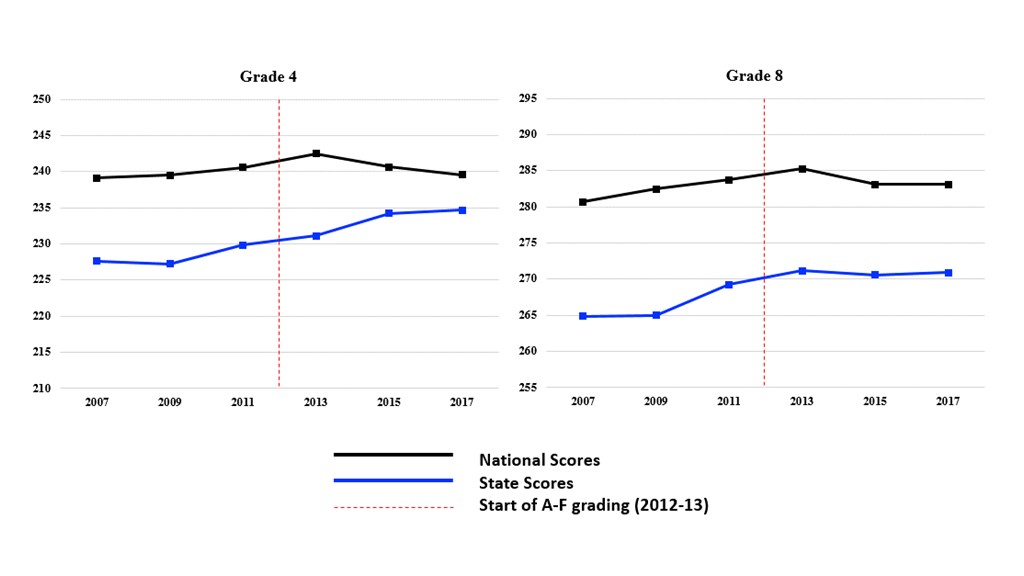
Figure 6. Mississippi grade 4 and grade 8 mathematics composite scores over time
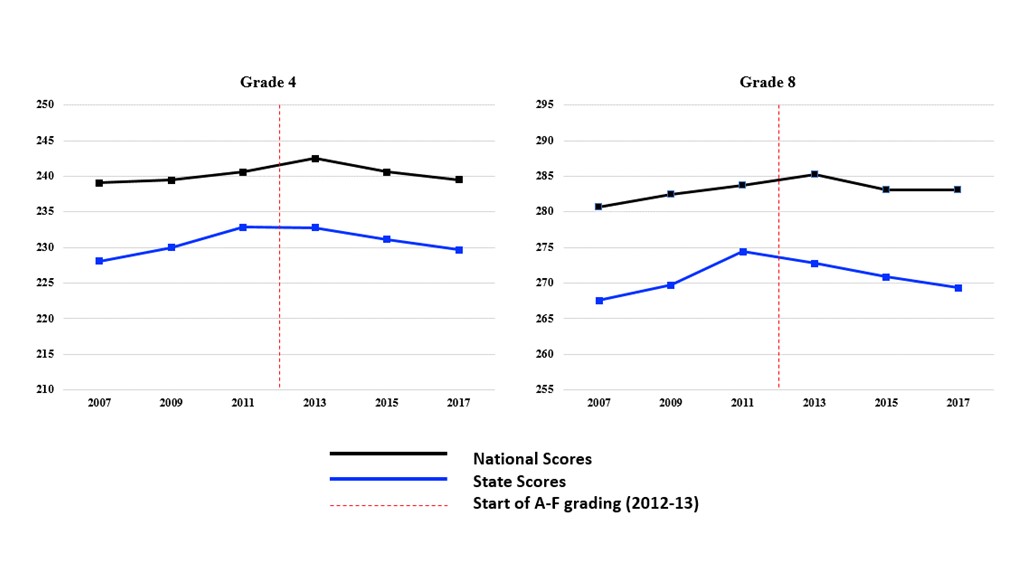
Figure 7. New Mexico grade 4 and grade 8 mathematics composite scores over time
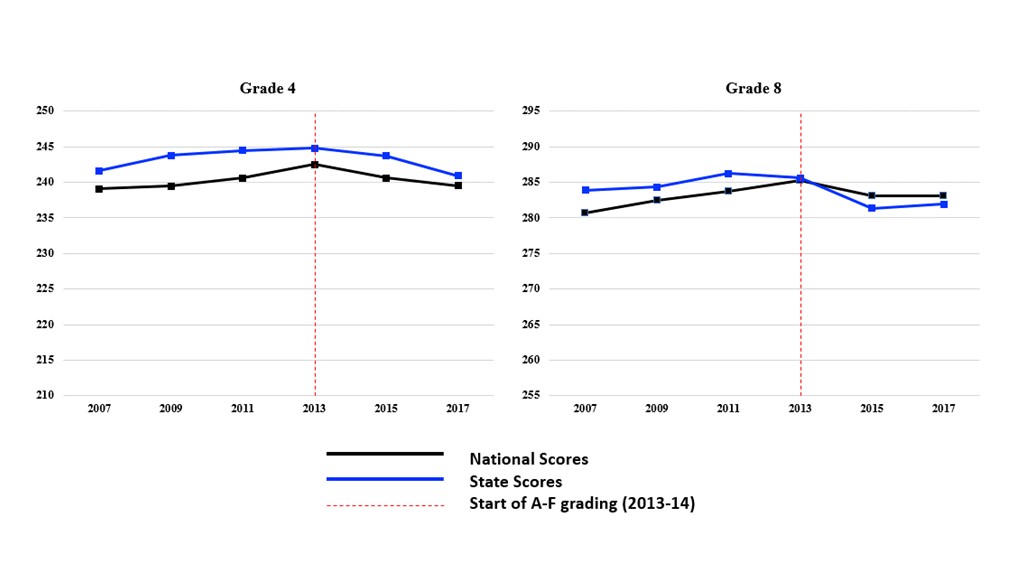
Figure 8. North Carolina grade 4 and grade 8 mathematics composite scores over time
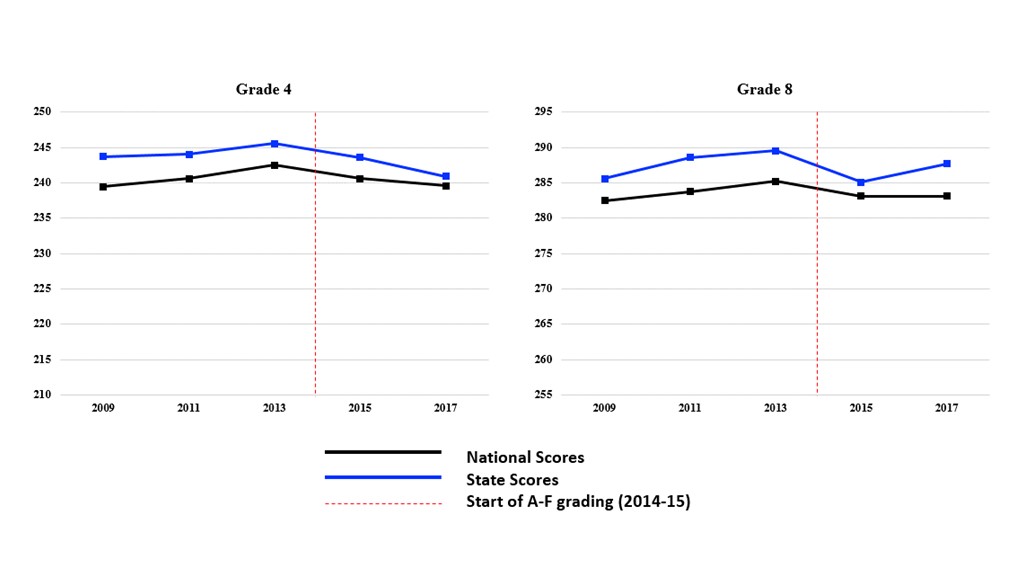
Figure 9. Ohio grade 4 and grade 8 mathematics composite scores over time
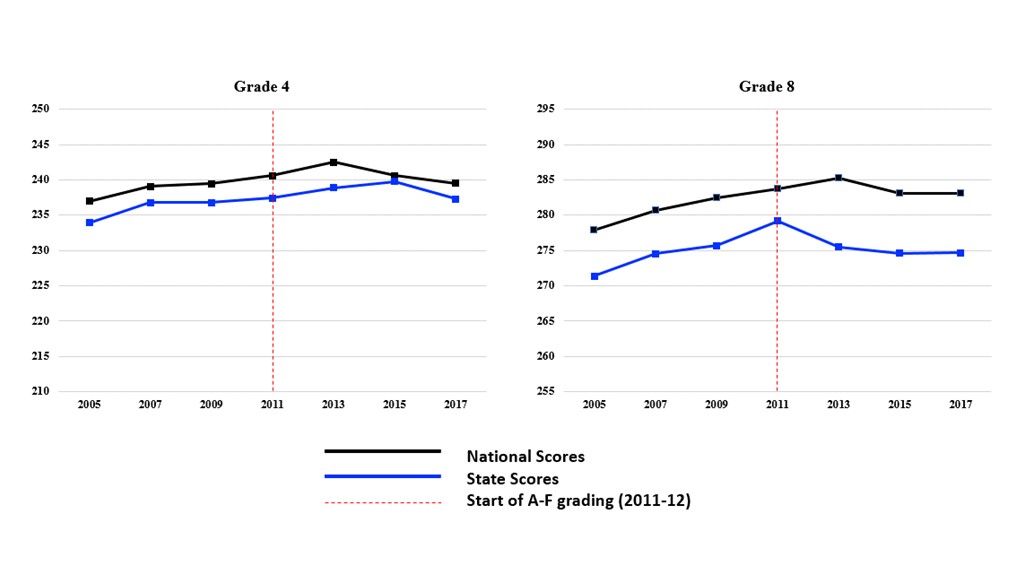
Figure 10. Oklahoma grade 4 and grade 8 mathematics composite scores over time
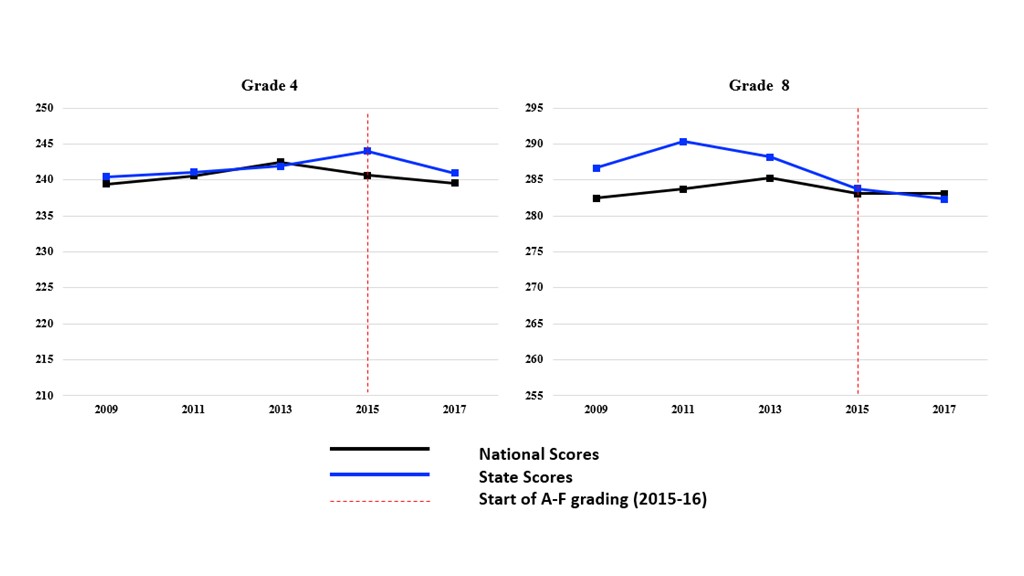
Figure 11. Texas grade 4 and grade 8 mathematics composite scores over time
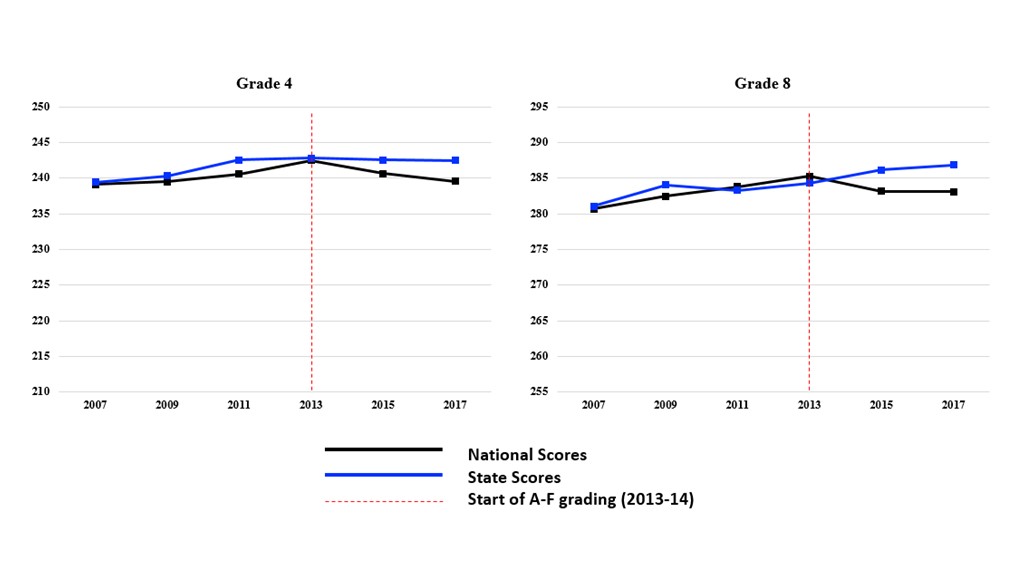
Figure 12. Utah grade 4 and grade 8 mathematics composite scores over time
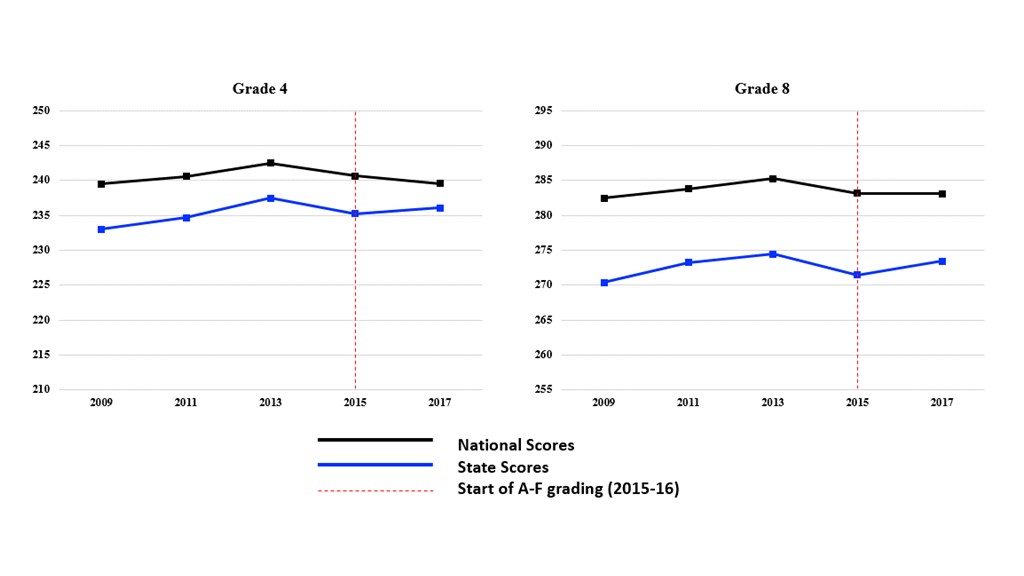
Figure 13. West Virginia grade 4 and grade 8 mathematics composite scores over time

Share this content